
The dashboards
Dashboards
Clinic Administrator
A dashboard shows the clinic’s figures over a period you choose. The figures are worked out from the data in Digiodent
each time you open the dashboard. Only the clinic administrator sees the Dashboards app.
The clinic’s dashboards
Section titled “The clinic’s dashboards”The clinic’s dashboards are named and written in Romanian, whatever the app’s language.
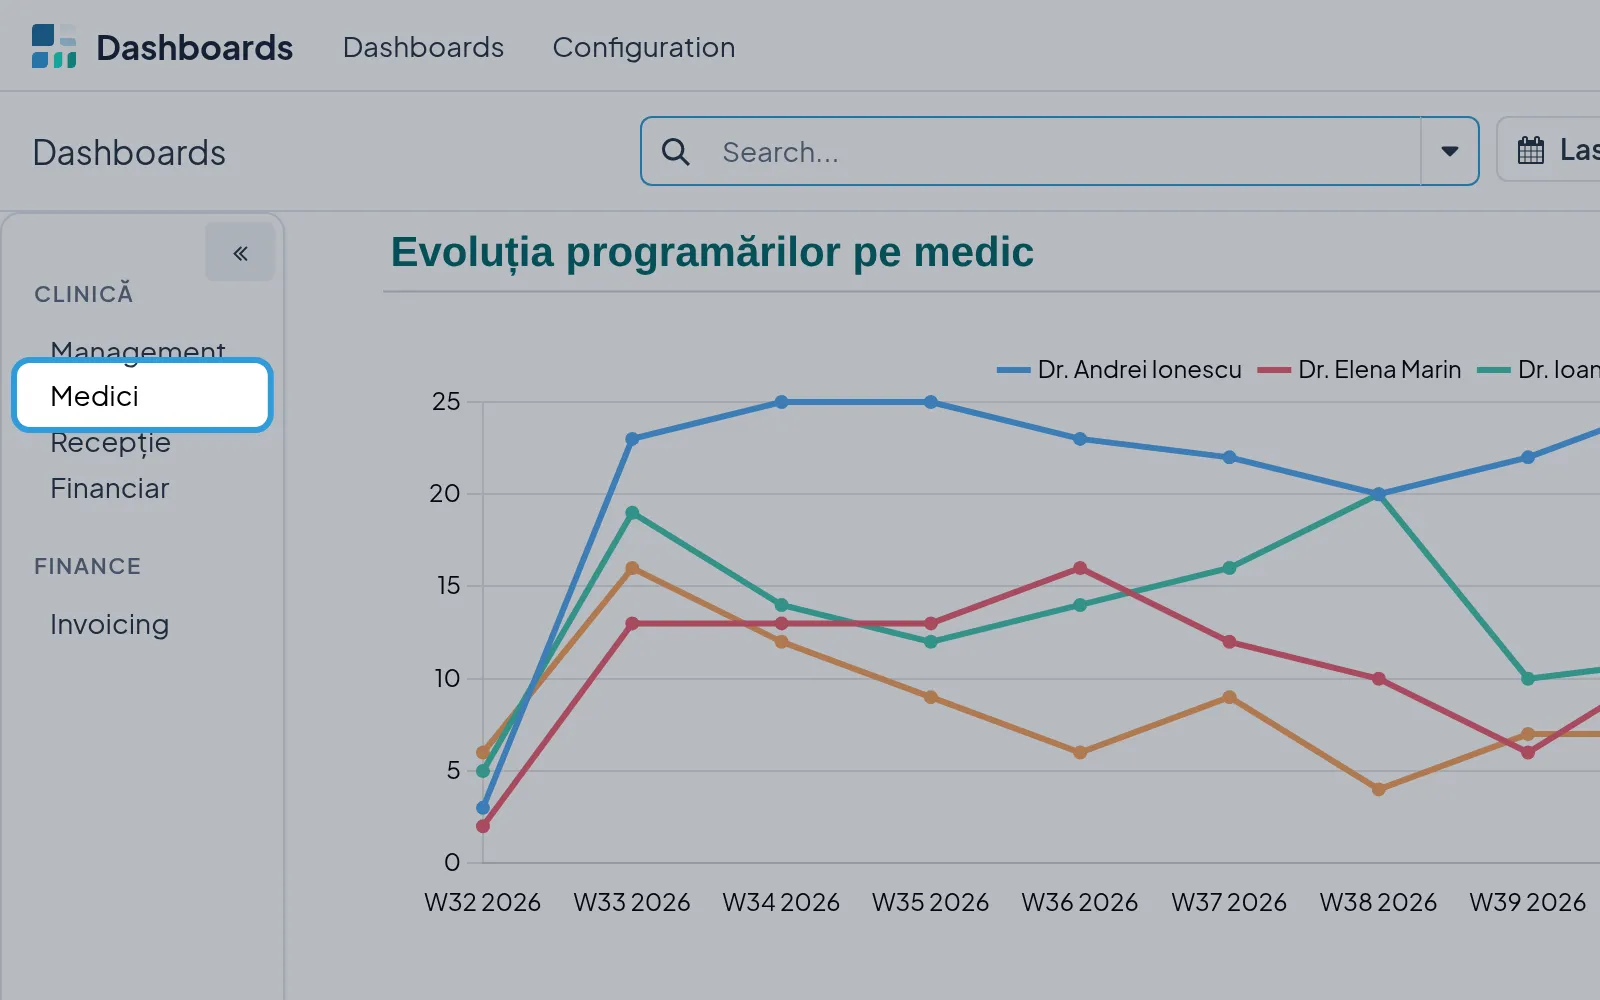
Management: revenue before VAT, visits, patients treated, the average value of a visit, revenue per month, per service category and per doctor, and the procedures done most often.Medici(doctors): each doctor’s appointments, week by week and by status, then each doctor’s revenue, visits and procedures.Recepție(reception): the period’s appointments, with the patient, the time, the doctor and the status, the cancellations and the share of patients who did not come. It opens on today.Financiar(finance): what was invoiced and collected, what patients still owe, overdue invoices and supplier bills to pay.Invoicing, underFINANCE: the invoices issued, the average invoice and how many days, on average, an invoice takes to be paid.
The others open on the last 90 days.
Open a dashboard
Section titled “Open a dashboard”- Tap the dashboard in the panel on the left, for example
Medici.
The dashboard opens on its period, written on the button above it.
Choose the period
Section titled “Choose the period”All the dashboard’s figures, charts and tables show the period chosen.